Why do they happen?
We are all humans and even the best of us make mistakes. Professional software developers are no exception. Computers are great validators of errors. They will never agree to a mistake, thus they will always report it through an error message or through some general disfunction. In this section we will learn how to deal with errors in our editors.
How do I know that the error happened?
Most of the errors will be reported to you in the form of a modal. A modal is a pop-up window that will display some sort of error message that computer encountered. You will need to close the modal in order to continue working on the fix.
There are many potential errors that may happen. Blockly and Rete editors report the errors on the components that are causing them - such components after the execution turn reddish. Monaco editor for TypeScript will report potential mistakes while you write code. It will underline the code with red and you can hover over it to see the error message. But if you run the TypeScript code, you may also see a modal with an error in it.
Errors in Rete editor
Rete editor is interactive and you can see errors quite fast. If you change the input of the component and it turns red - you know that there is a problem. See an example if an error that happened while using the Rete editor in the picture below.
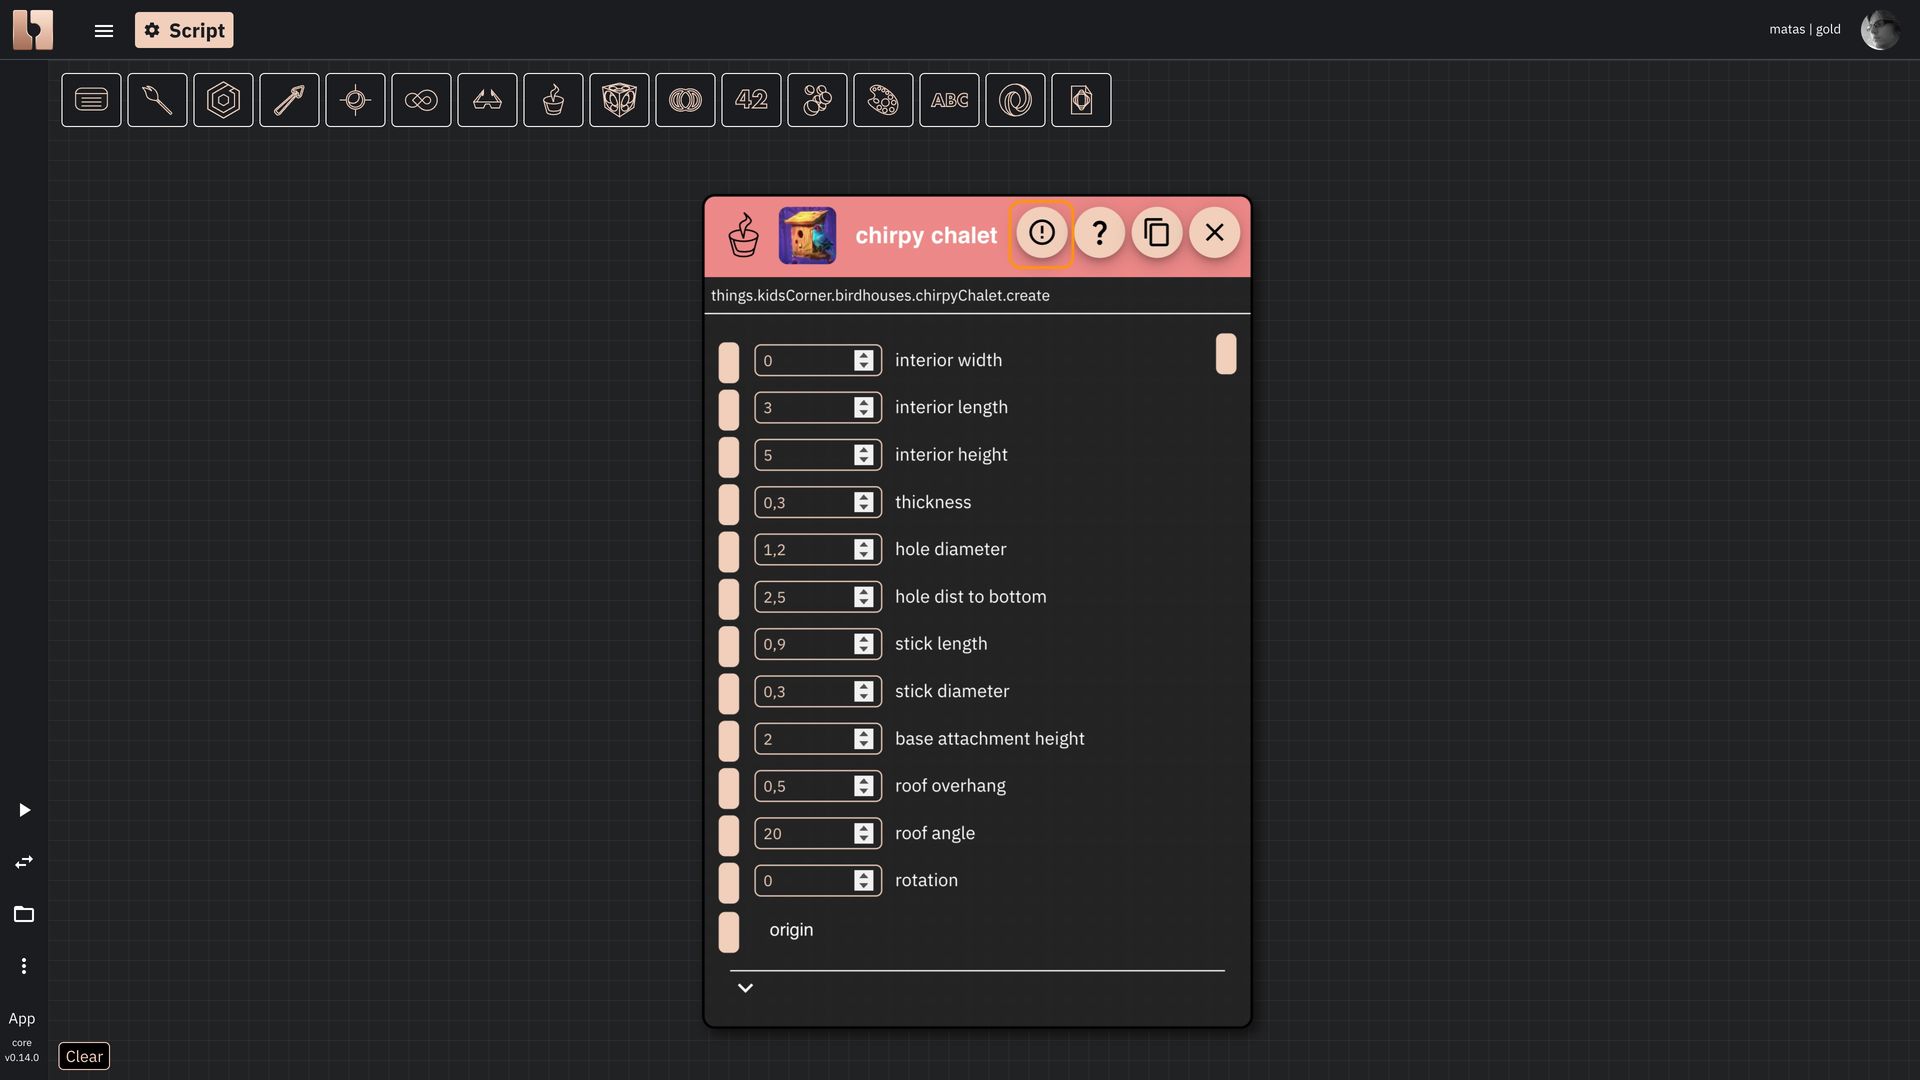
Example of a component with an error in Rete editor
In this particular case the width of the "chirpy chalet" component is set to 0 and thus algorithm can not compute geometry for such a component. If you click on the button marked with ! symbol, you will see the error message in the modal. Check the picture below how the error looks like.
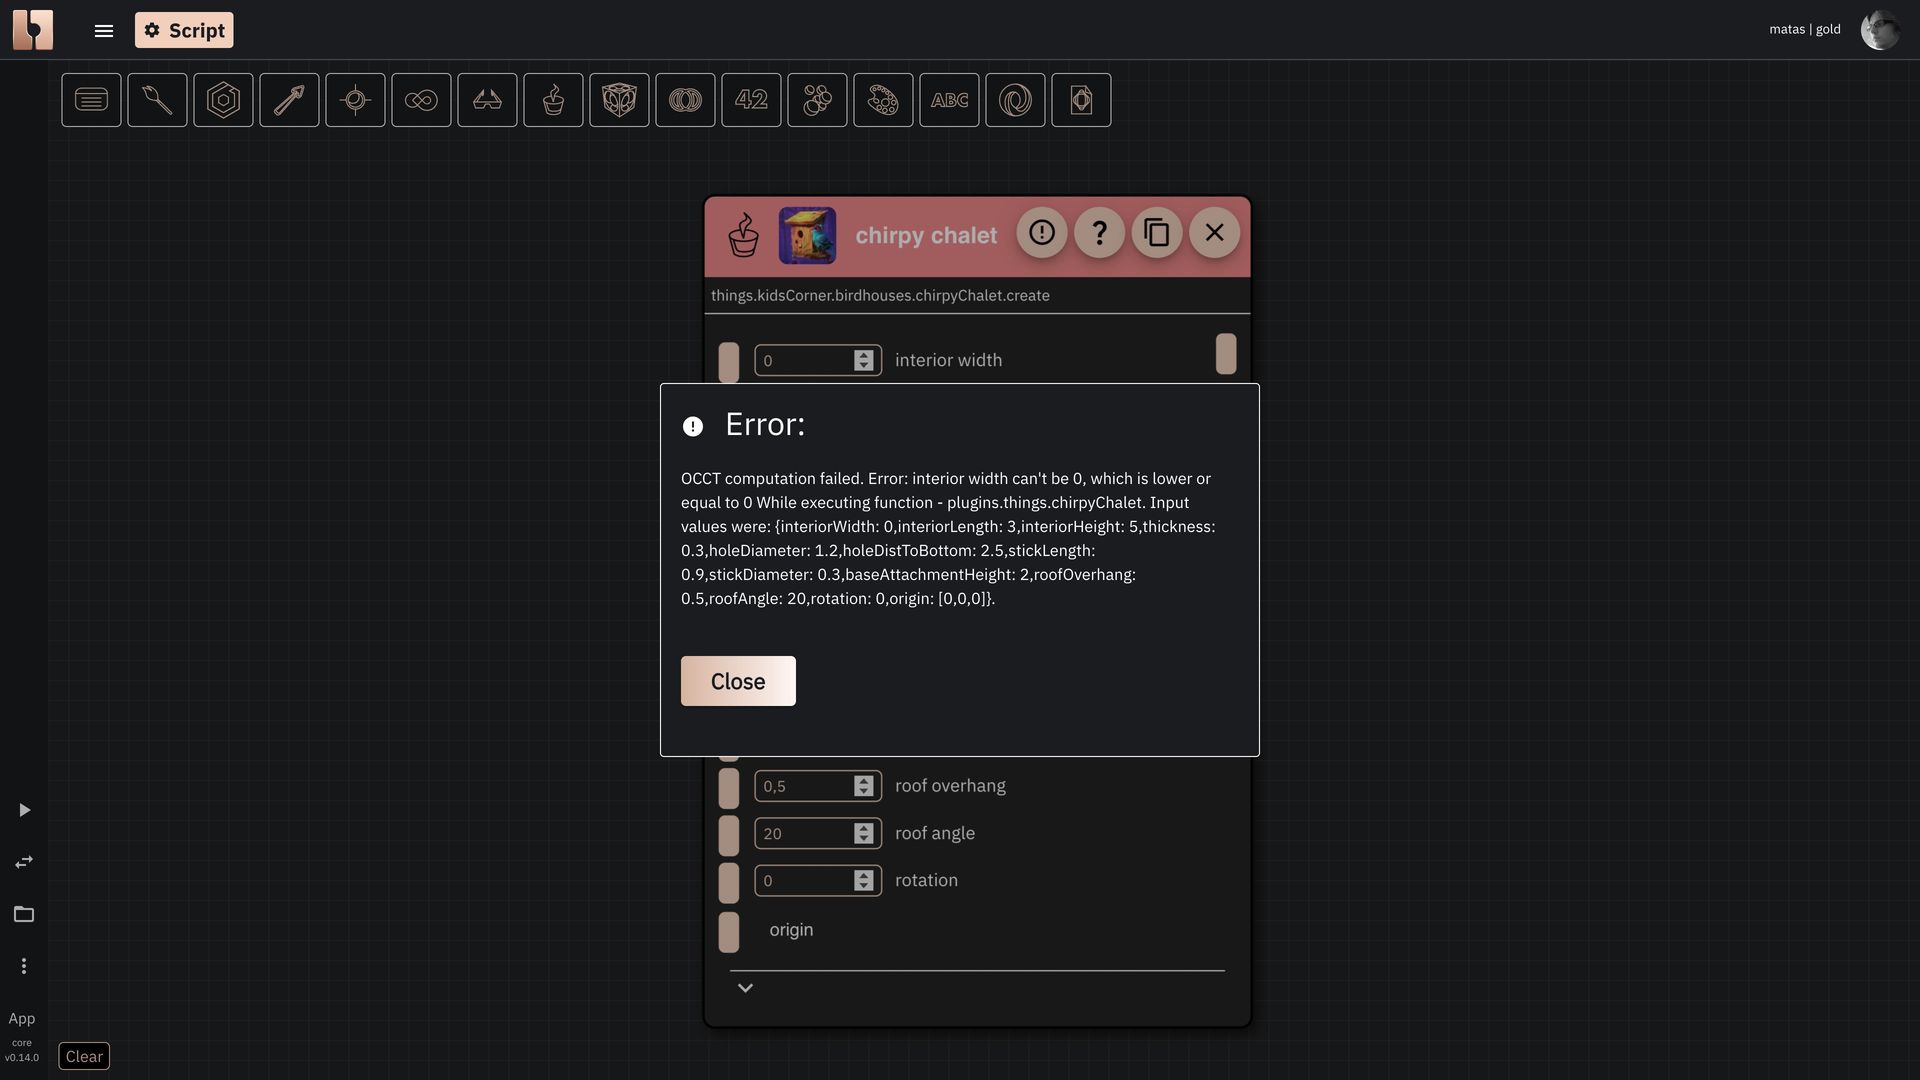
Example of an error modal containing information about the error that happened in Rete editor
This error simply indicates that interior width can't be 0. You can fix this error by changing the width of the component to some other value. Rete component will trigger execution immediately and if everything is correct, component will turn to it's normal colour.
Errors in Blockly editor
Blockly editor will also report errors on the components that are causing them. See an example in the screenshot below:
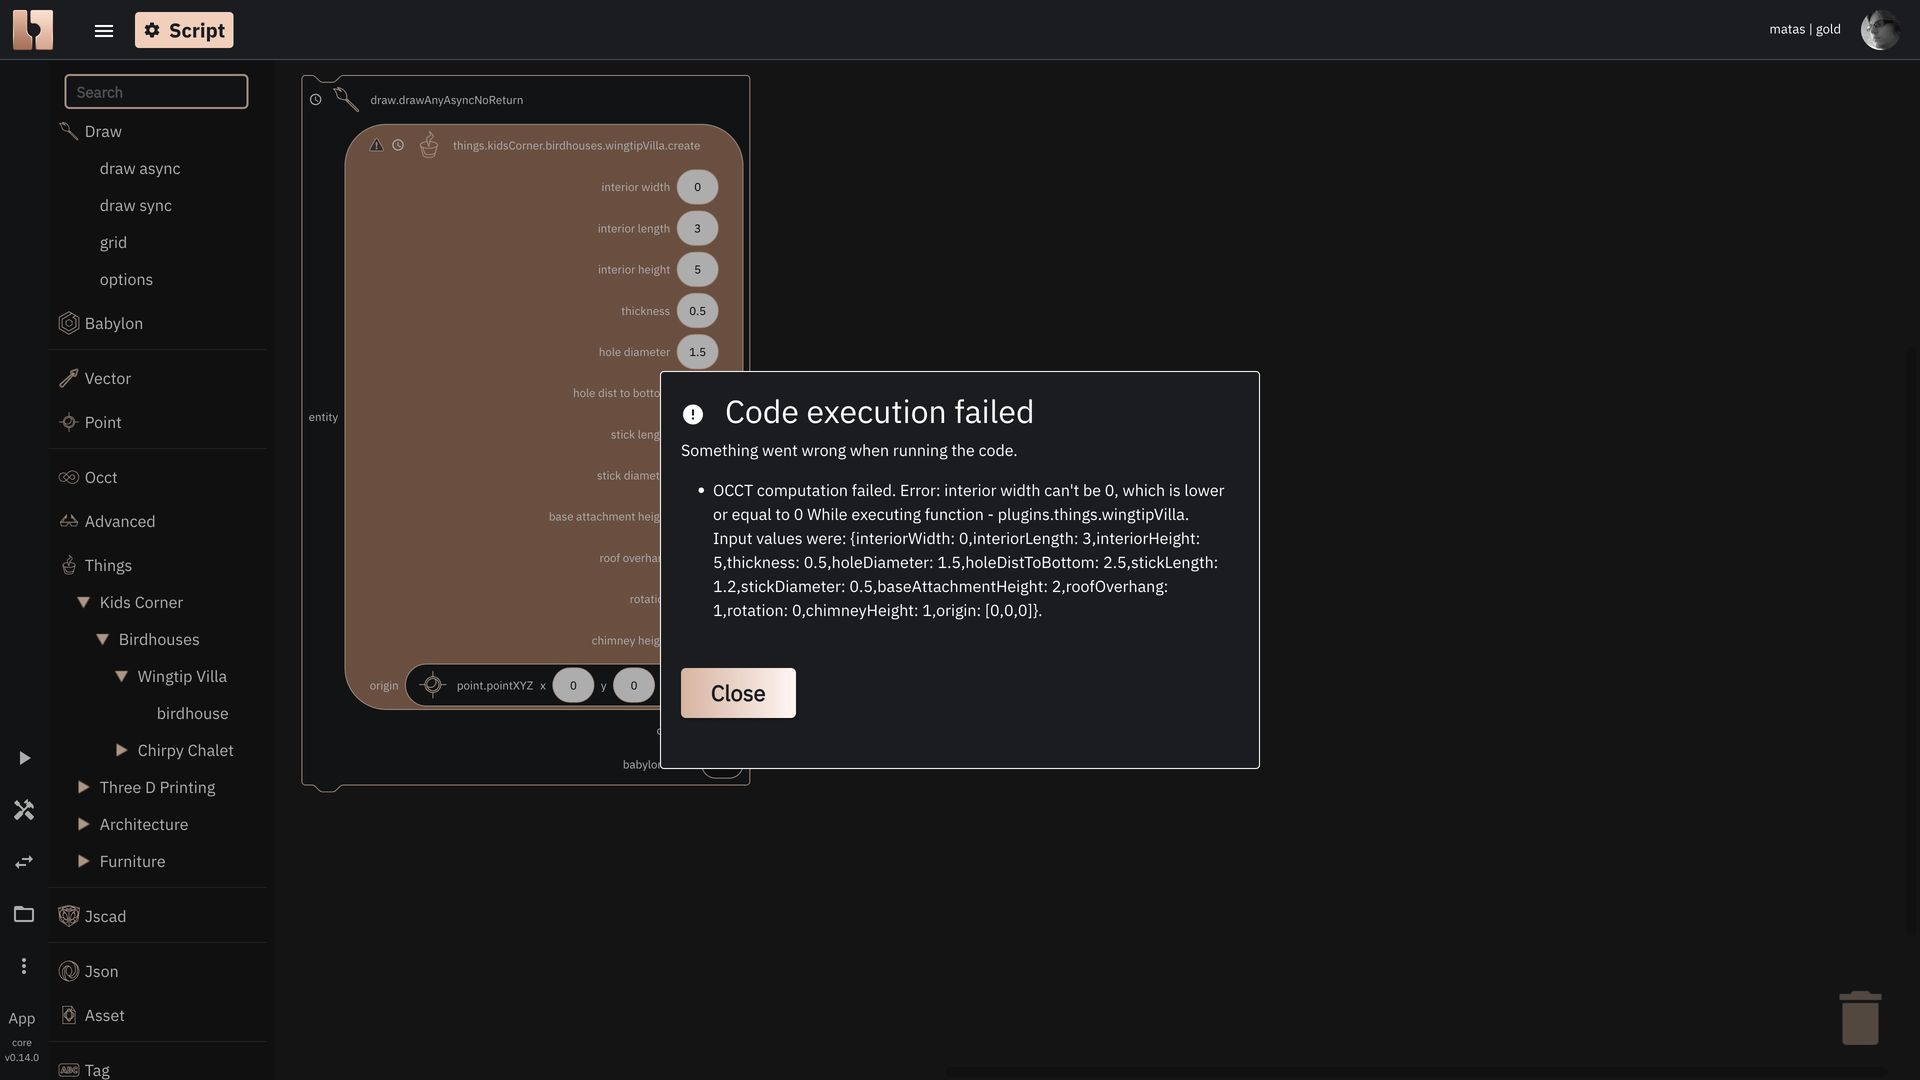
Example of an error modal containing information about the error that happened in Blockly editor
The only difference between Rete and Blockly is that Rete will show an error immediately when it happens. You do not need to Run the code, unless, of course it is the first time you opened the script. Blockly on the other hand will show the error only after you click the Run button. In case there are many errors, Blockly will try to collect them in the list and display the list to you. Components on the canvas will also be red, containing specific error messages. You can check those messages by clicking a triangle icons with ! symbol.
Errors in Monaco editor for TypeScript
TypeScript is a programming language that is great for both professionals and beginners alike. It is strongly typed, which means that it will prevent you from doing many common mistakes, such as assigning things to variables that do not exist or accidentally changing the variable from text to a number or, in fact, countless other potential mistakes. This error reporting can be quite irritating, but at the end it saves a lot of time and effort when fixing strange unexpected bugs. TypeScript will report errors while you write code. It will underline the code with red and you can hover over it to see the error message. Check out the picture below to see how it looks like.
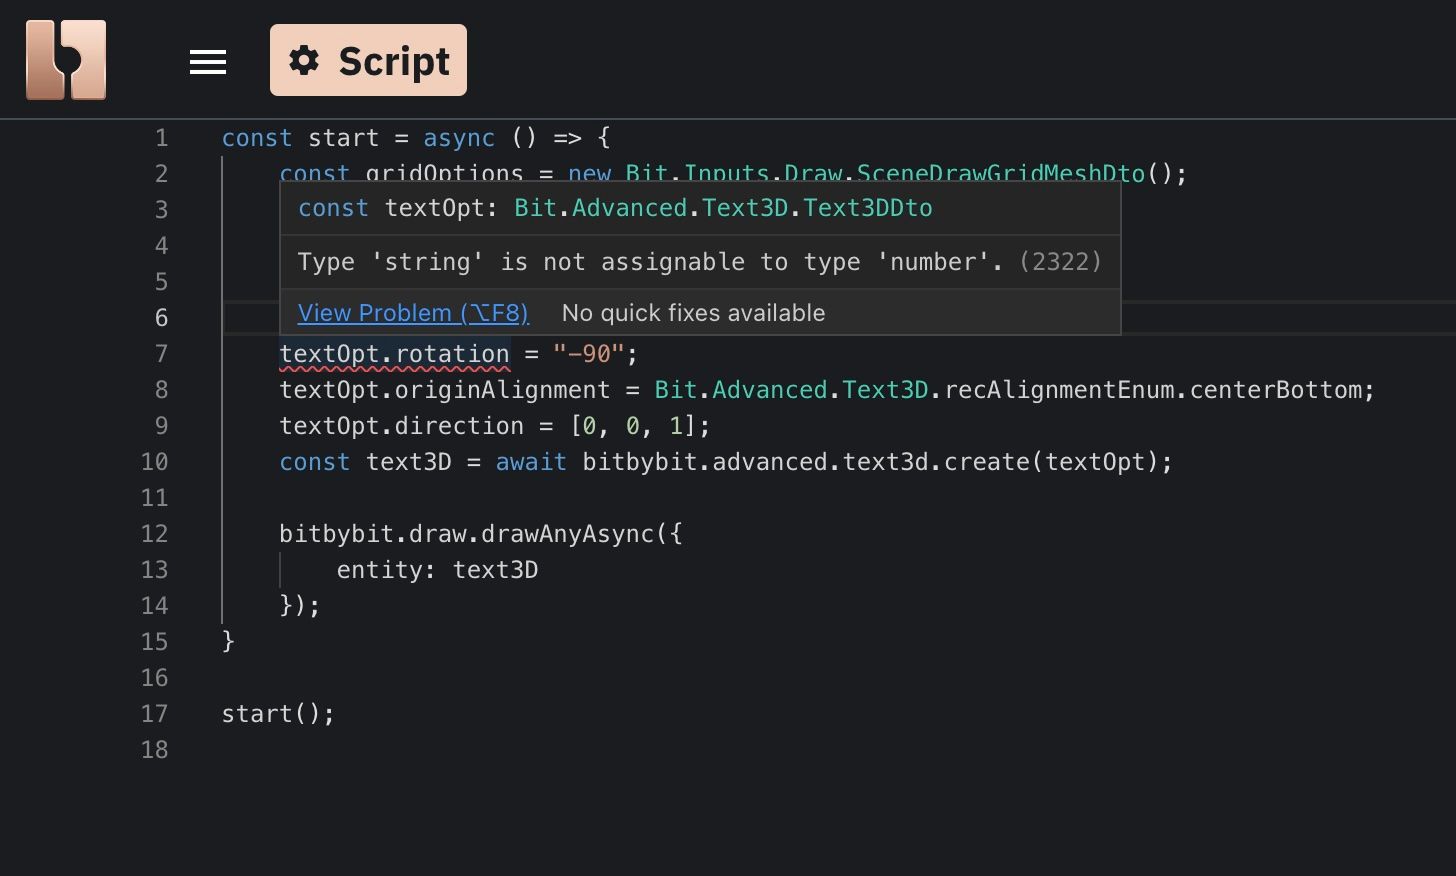
Example of an error in Monaco editor
If you have a suspicion that an error happened but you do not see it in the editor, you can always check your console of the browser. In Chrome you can click F12 to open developer tools. You may find some useful information there that was otherwise unreported. You can also do many other amazing things, such as profiling the performance of your code and many other. We will not go into details of the developer tools here, but you can check out the official documentation for Chrome browser to learn more. If you use different browsers, check their documentation.